
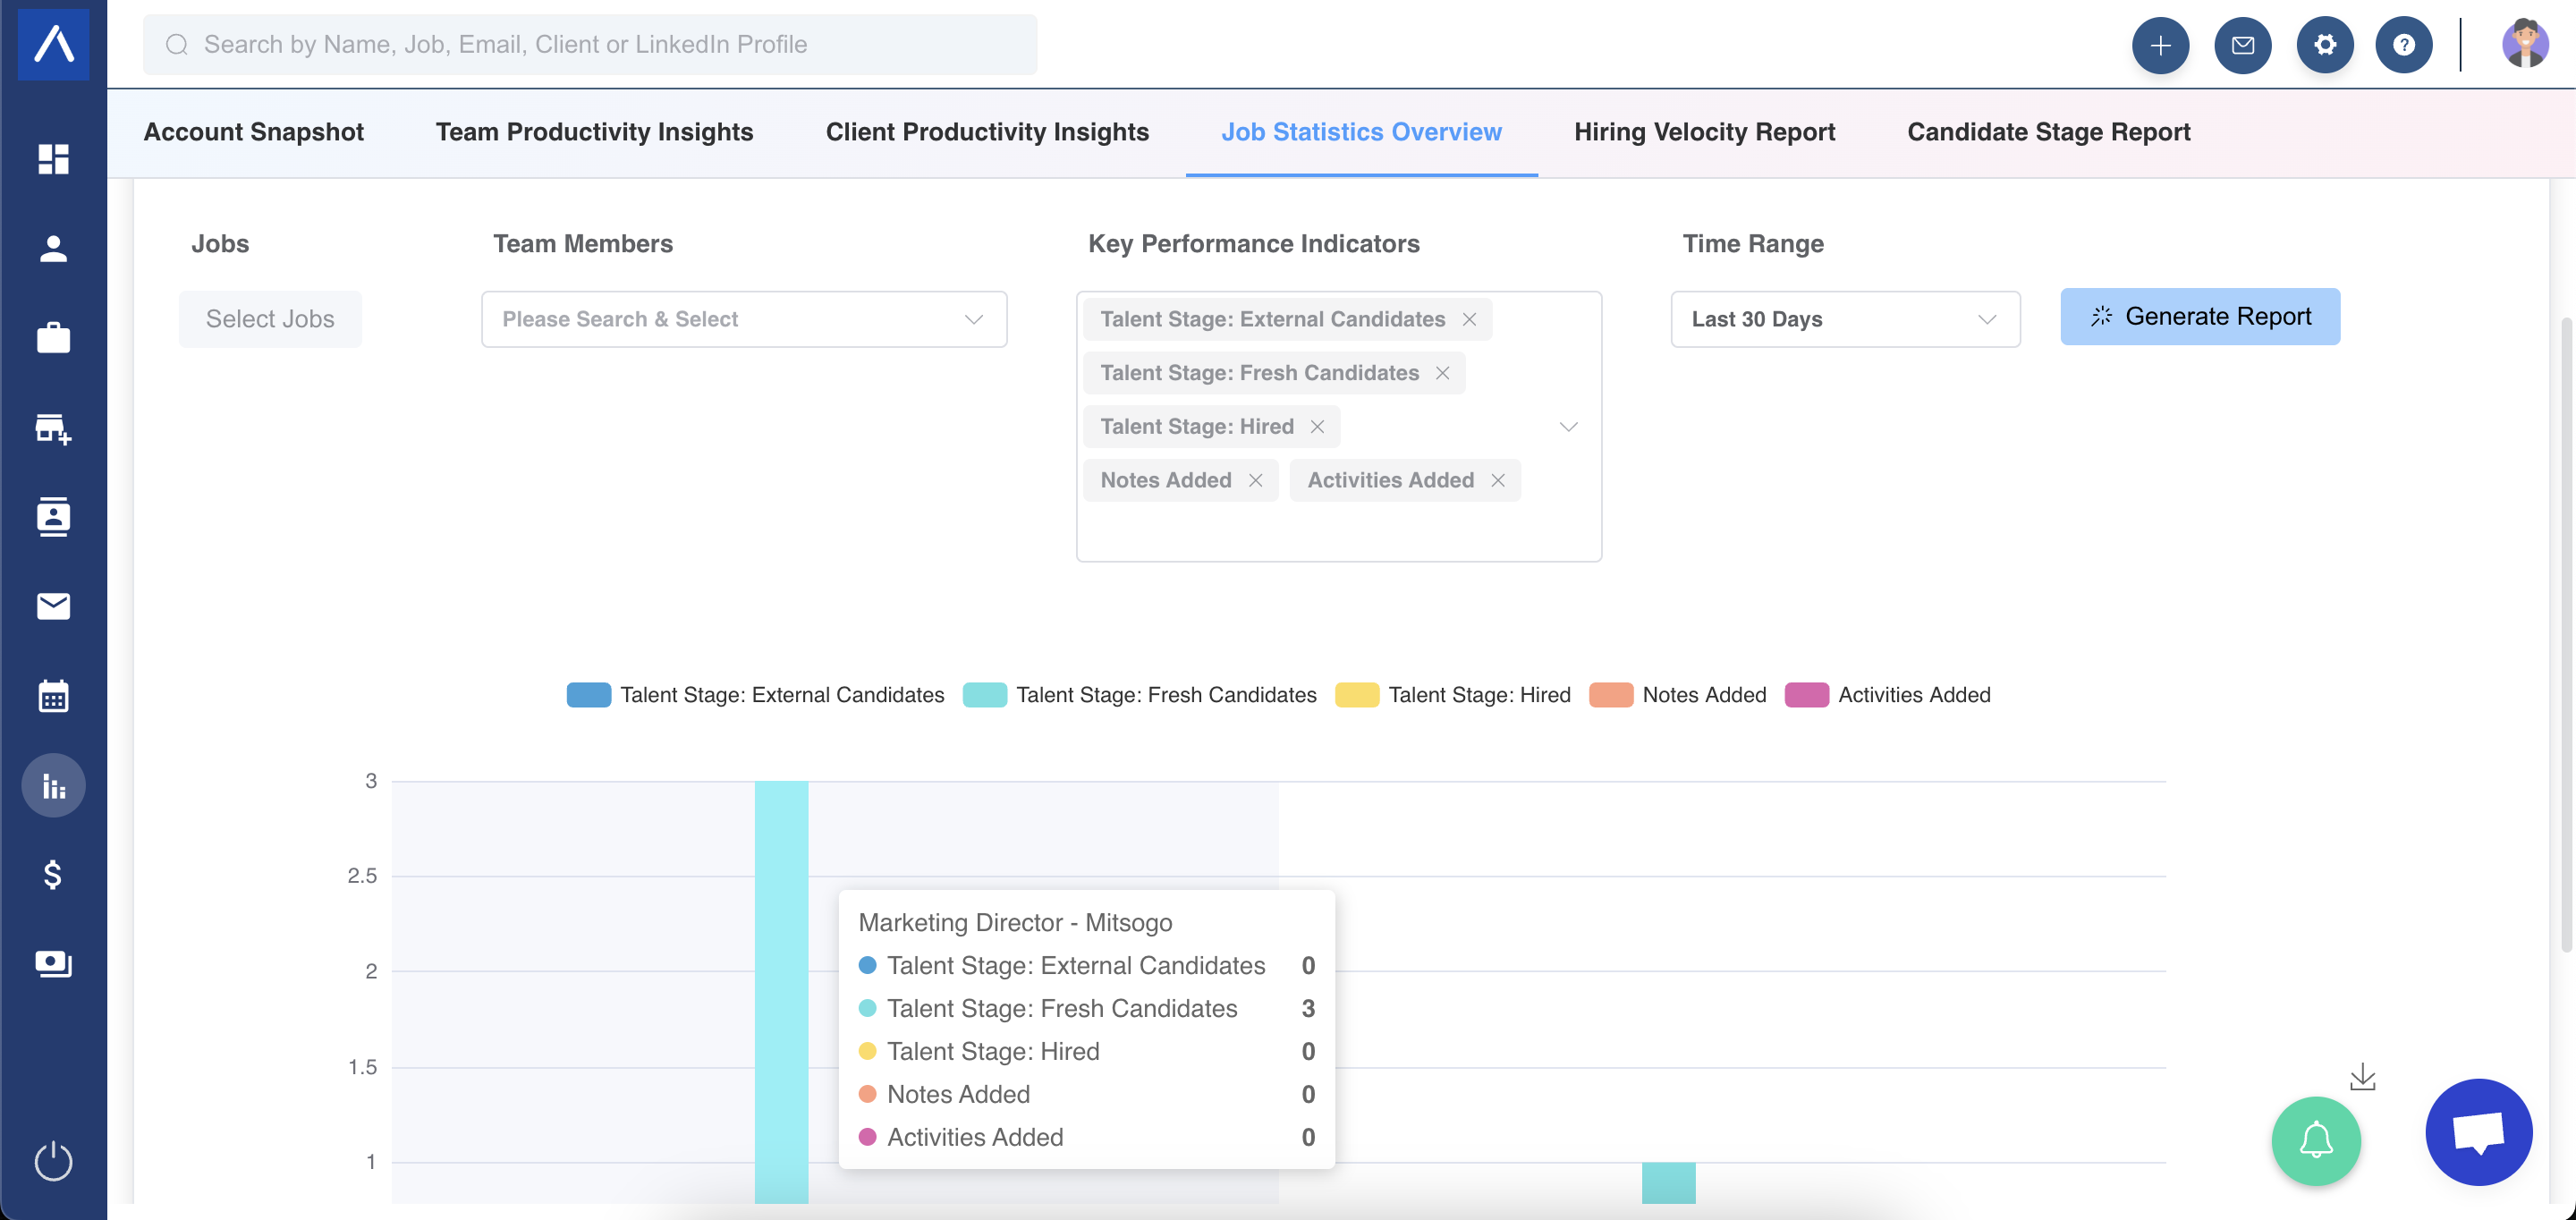
Job Statistics Overview
The Job Statistics Overview offers a detailed perspective on the performance of each job listing in your portfolio.
You can effortlessly generate a report covering all your jobs, utilizing available Key Performance Indicators (KPIs) to evaluate if progress aligns with your objectives.
This tool allows you to compare different job listings, pinpoint top-performing ones, search for specific jobs, and export an Excel file with applicants’ names and their current stages in the recruitment process for a selected job.
Steps to Create a Report
Section titled “Steps to Create a Report”Once in the Job Statistics Overview, follow these steps to produce a report:
- Choose Jobs from the dropdown menu.
- Select the desired KPIs from the KPI dropdown.
- Set a time range and click the “Generate Report” button.
Important Notes
Section titled “Important Notes”- Historical Data: Metrics related to hiring stages (e.g., External Candidate, Hired) reflect historical data. Candidates were in those stages during the chosen date range, but their current stage may have changed.
- Interactive Visuals: The report displays bar charts based on your selections, with each bar representing specific data.
We hope this guide simplifies your experience with the Job Statistics Overview!